Sample Pie Chart in Chart.js
How to draw a pie chart in chart.js
The chart.js javascript charting library can be used to create several types of awesome and colorful charts with small or large datasets.
Compared to the other javascript charting libraries, chart.js is a lot simpler to use and easy to set up.
You will not need to be a master of js to create charts in chart.js. However, some knowledge of javascript can be highly useful for various types of configurations.
In this tutorial, we are going to draw a pie chart using chart.js, with datalabels and tooltip. Apart from pie charts, you can also draw bar charts, line charts, radar charts, bubble charts and mixed charts in chart.js.
Chart.js offers the datalabels plugin that can be used to apply datalabels to your chart.
Most elements in chart.js can be easily configured including title, subtitle, background color, font etc.
You can also animate your chart and make it responsive to suit various screen sizes. Now, let’s see how we can draw a pie chart in chart.js
Install chart.js
Before you can present a chart in html using chart.js, you will need to install the chart.js javascript library to start drawing charts.
There are two main methods to install the chart.js charting library. You can install it using either the cdn link or through the help of npm. The recommended method is the cdn link.
To install chart.js on your website, just add the following script to your website header:
<script src="https://cdn.jsdelivr.net/npm/chart.js@4.4.2/dist/chart.umd.min.js"></script>
The above script will install chart.js 4.4.2, the latest version of chart.js on your website. To get the latest version, you can always visit the chart.js website. Another method to install the chart.js javascript library is via npm. You can install chart.js on your server using npm so that all the websites hosted on the server can use the charting library.
npm install chart.js
Once installation is complete, you can move on to creating the charts of your choice.
Create a pie chart in chart.js
The chart type we are going to create in this tutorial is the pie chart. You can create and customize awesome looking pie charts with background colors of your choice using chart.js. Apart from that, you can apply datalabels to the chart and customize the tooltip.
To create a pie chart, basically we need to change the chart type to pie. Rest of the script remains the same as the other charts excluding some customizations.
First of all, we will draw a canvas for the pie chart.
For example, we will create a simple pie chart with the following script:
<div>
<canvas id="myChart"></canvas>
</div>

<script src="https://cdn.jsdelivr.net/npm/chart.js"></script>
<script src="https://cdn.jsdelivr.net/npm/chartjs-plugin-datalabels@2.0.0/dist/chartjs-plugin-datalabels.min.js"></script>


<script>
Chart.register(ChartDataLabels);
  var ctx = document.getElementById('myChart');

  new Chart(ctx, {
    type: 'pie',
    data: {
      labels: ['Americas', 'Europe', 'China', 'Japan', 'Asia Pacific'],
      datasets: [{
        label: 'Revenue',
        data: [169.7, 95.12, 74.2, 26, 29.4],
          backgroundColor:  [
     'rgb(255, 99, 132)',
      'rgb(255, 159, 64)',
      'rgb(255, 205, 86)',
      'rgb(75, 192, 192)',
      'rgb(54, 162, 235)',
    ],
       hoverOffset: 70,
        borderWidth: 1,
        borderRadius: 5,
      }]
    },
    options:
 { interactions: {mode: 'index'}, responsive: 'true',
plugins:
 {tooltip:{position:'nearest', intersect: false, backgroundColor: 'white', titleColor: 'black',bodyColor: 'black',displayColors: false, yAlign: 'bottom', caretPadding: 5, padding:12, titleMarginBottom: 10,
callbacks: {
     label: function (context) {
        return  context.dataset.label + ': ' + '$' + context.formattedValue + ' billion'; }
   }, },
legend: {position: 'bottom'},
title: {display: true, text: 'Apple Geographic Revenue 2022 in $ billions', font: {size: 14}}, datalabels: {align: 'end', Color: 'black', backgroundColor: 'white',anchor: 'middle', font: {size: 14, weight: 'bold'},  formatter: function(value) {
          return ' $' + value + ' billion';
        },}},
      scales: {
       y: [{
          beginAtZero: true,

        }

        ]
      }
    }
  });
</script>
.webp) Pie Chart
Pie Chart
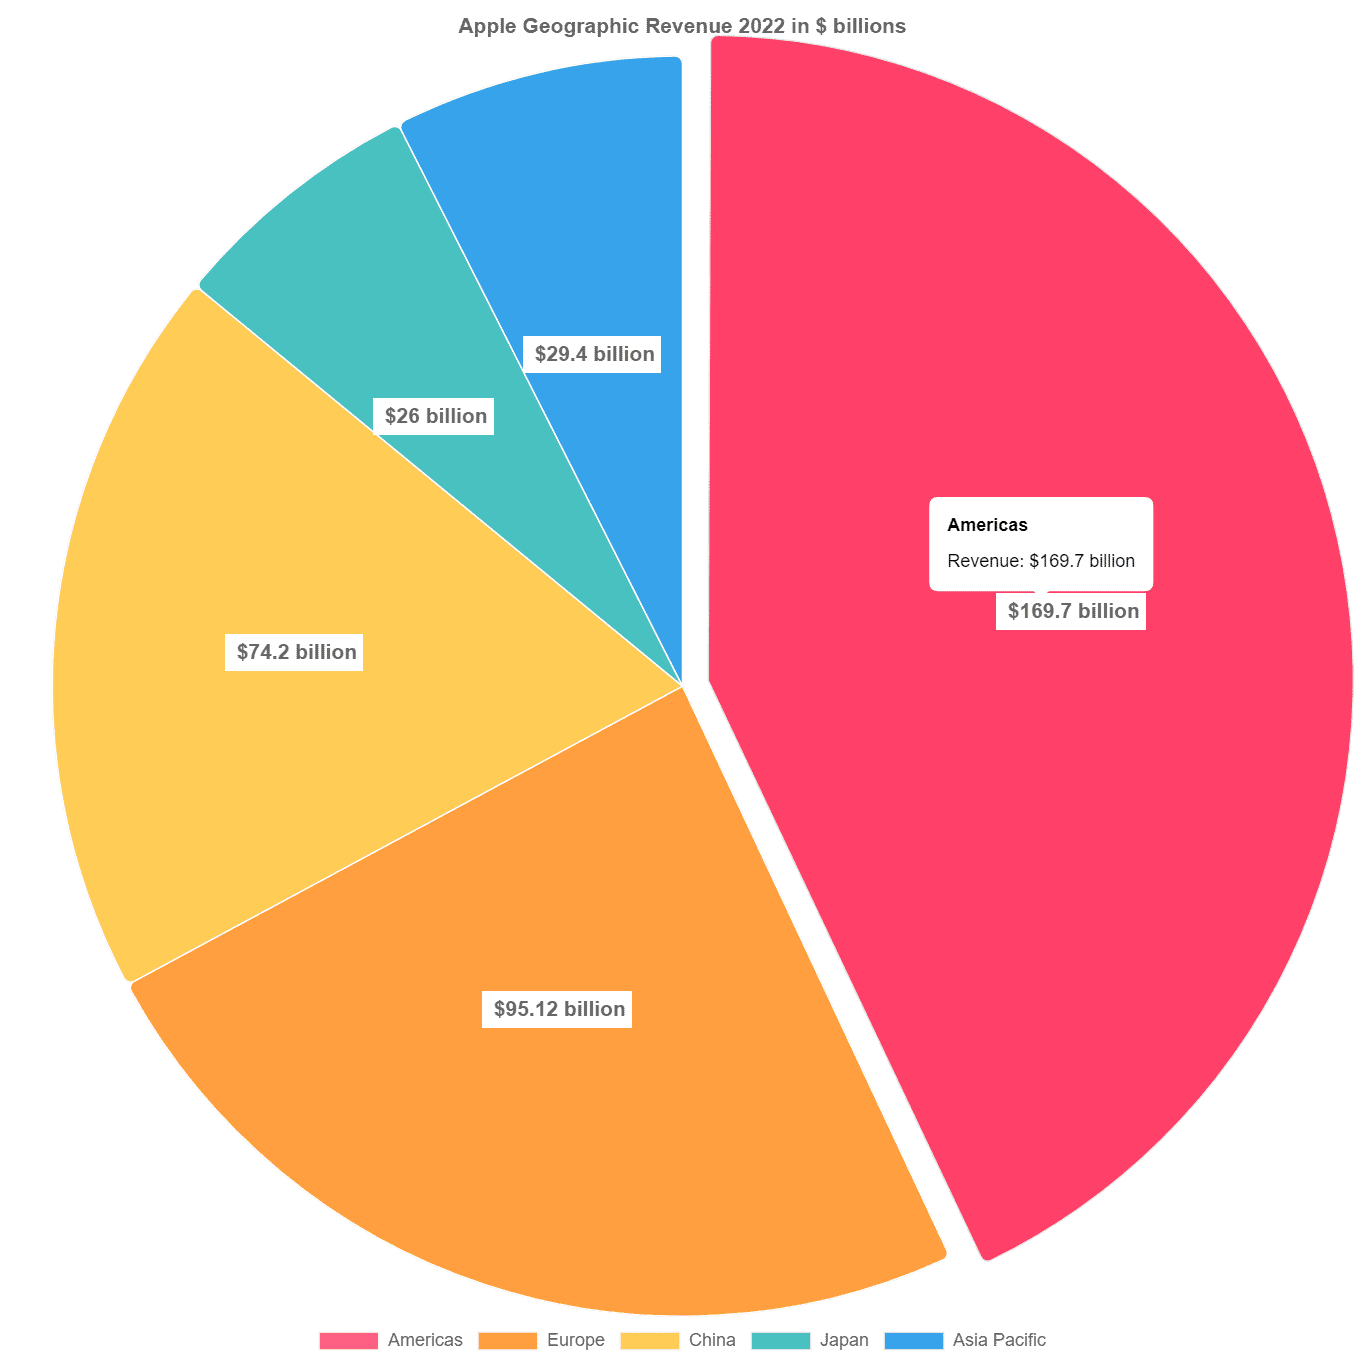
In the above example, we have drawn a colorful pie chart displaying the geographical revenue of Apple company for 2022. We have also given a slight border radius to the sections of the pie chart and made some more customizations to the datalabels and the tooltip.
We have added the dollar sign to the tooltip of the pie chart using a callback and used a formatter to add dollar sign to the datalabels.
callbacks: {
     label: function (context) {
        return  context.dataset.label + ': ' + '$' + context.formattedValue + ' billion';
     }
   },
The formatter for adding $ sign to datalables in chart.js:
datalabels:{
formatter: function(value) {
          return ' $' + value + ' billion';
        },}
Apart from that, we also changed the background color of the tooltip to white. The default color is black. The configurations to change the appearance of the tooltip are set inside the plugins section in options. options.plugins.tooltip
plugins:  {tooltip:
{position: 'nearest',  intersect: false, backgroundColor: 'white', titleColor: 'black', bodyColor: 'black', displayColors: false,  yAlign: 'bottom',  caretPadding: 5,  padding:12,  titleMarginBottom: 10,  callbacks: {
     label: function (context) {
        return  context.dataset.label + ': ' + '$' + context.formattedValue + ' billion';
     }
   }, },
We also gave our pie chart a title that displays at the top. The title can be set by configuring it inside the plugins and setting its display to true. Options.plugins.title
options:{plugins:{
title: {display: true,  text: 'Apple Geographic Revenue 2022 in $ billions',  font: {size: 14}},
}
},
As you can see in the above example, we set the display for title to true and then add the title text and fix the font size at 14.
To add the hover effect to our pie chart, we have used the hoverOffset function. It gives the pie chart an exploded look when you hover over any section of the pie chart.
The section that you hover over will detach itself from the rest, giving the pie cart an exploded look. We added a hoverOffset: 70 in the above chart. (70 means 70 pixels.)
%20(1).png)
Our pie chart is complete. To place the legend at the bottom, we applied position: bottom for the legend. Options.plugins.legend
legend: {position: 'bottom'},
You can set the background colors of each section in the pie chart using backgroundColor.
At the end, you have an attractive pie chart with sections of different colors, a title and each section having labels with currency sign.