Title and Subtitle Chart.js
How to Add title and subtitle in chart.js
Chart.js is a javascript charting library used for creating charts of various types including line charts, bar charts, mixed charts radar charts, bubble charts, pie charts and so on. Chart.js is also the most popular javascript charting library based on the number of Github stars and downloads. One of the leading reasons it is so popular is that it is highly customizable. You can use plugins that can add new functionalities and help you create absolutely awesome looking charts. It is easy to add datalabels and tooltip with chart.js to make your charts more attractive and informative.
Chart.js is open source which means it is free. However, it is a well maintained charting library and you do not need to be a master of javascript to draw charts with chart.js.
When you create charts using any library, you may also need to add titles and subtitles to it.
In this post, we are going to discuss how to apply titles and subtitles to your chart.js chart.
Install chart.js
As a first step to creating charts with chart.js, you need to install the library on your server or website. You can add the cdn link to your website to use chart.js on your website or you can install it on your server using npm. The recommended way to do this is to use the header script with the cdn link. Just add the script below to your website’s header:
<script src="https://cdn.jsdelivr.net/npm/chart.js@4.4.2/dist/chart.umd.min.js"></script>
Otherwise, you can install it using npm on your server which is a method some people prefer if they do not want to make changes directly inside the html code of their website. If you do not have npm installed on your server, you can install it with sudo apt install npm. To install chart.js using npm, run the following command from the command line:
npm install chart.js
Now, you have the chart.js javascript charting library installed and you can start creating awesome, colorful and well customized charts of diverse types.
Create a chart and apply title and subtitle
In this post, we will show you how to apply and customize titles and subtitles on charts built using chart.js with the help of a simple bar chart. A title tells your visitors what the chart is about and a subtitle can be used to provide additional information. Suppose, you want to add your website’s name at the bottom of each chart, you can add it as a subtitle and place it at the bottom of the chart. You can use subtitles for branding and provide additional information regarding charts and chart data.
To create the chart, we first draw a canvas and then add the script that creates the chart. The canvas is required to display the chart.
First, we draw the canvas for drawing the chart:
<div> <canvas id="myChart"></canvas> </div>
Now, we can add the script that generates the chart. We will create a simple bar chart that shows the revenue of Apple company in fiscal 2022 from different geographic regions:
<script src="https://cdn.jsdelivr.net/npm/chart.js"></script> <script src="https://cdn.jsdelivr.net/npm/chartjs-plugin-datalabels@2.0.0/dist/chartjs-plugin-datalabels.min.js"></script>


<script> Chart.register(ChartDataLabels);
var ctx = document.getElementById('myChart');
new Chart(ctx,
{ type: 'pie',
data: {
labels: ['Americas', 'Europe', 'China', 'Japan', 'Asia Pacific'],
 datasets: [
{ label: 'Revenue',
data: [169.7, 95.12, 74.2, 26, 29.4],
backgroundColor: [
'rgb(255, 99, 132)',
'rgb(255, 159, 64)',
'rgb(255, 205, 86)',
'rgb(75, 192, 192)',
'rgb(54, 162, 235)', ],
borderWidth: 1,
 borderRadius: 5,
}
]
 },
 options: { interactions: {mode: 'index'}, responsive: 'true', plugins: {tooltip:{position:'nearest', intersect: false, backgroundColor: 'white', titleColor: 'black',bodyColor: 'black',displayColors: false, yAlign: 'bottom', caretPadding: 5, padding:12, titleMarginBottom: 10,
callbacks: { label: function (context) { return context.dataset.label + ': ' + '$' + context.formattedValue + ' billion'; } }, },
legend: {position: 'bottom'}, title: {display: true, text: 'Apple Geographic Revenue 2022 in $ billions', font: {size: 14}},
datalabels: {align: 'end', Color: 'black',
backgroundColor: 'white',anchor: 'middle', font: {size: 14, weight: 'bold'},
formatter: function(value) { return ' $' + value + ' billion'; },}},
scales: {
y: [{
beginAtZero: true,
}
]
 }
 }
 }
);
</script>
As you can see in the above code, the title is a plugin. So, we include it in the plugin section and then we can make adjustments as we need.
THere are three options to align the title which include start, center and end. It means you can align it at the beginning, in the middle or the end. You also have four positions for the title in four directions including top, left, right and bottom where you can position the title.
options: {
        plugins: {
            title: {
                display: true,
                text: 'Custom Chart Title',
               position: ‘top’,
              align: ‘center’,
              padding: {
                    top: 10,
                    bottom: 30,
                  font: {size: 12},
                }
            }
        }
    }
To enable the title for a chart, you need to set display to true for the title and then you can add the text of the title as we have shown in the above piece of code. If the title is touching the top of the chart or the chart under it, you can add padding at top or bottom according to the requirement. You can also adjust the font according to your need.
You can use the same method to enable a subtitle for your chart. All you need to do is to insert the details for subtitle in the plugins section. You can position the subtitle at the top, left, right, or bottom and align it in the start, center or end.
options: {
        plugins: {
           subtitle: {
                display: true,
                text: 'Custom Chart Subtitle',
               position: ‘left’,
              align: ‘center’,
                }
            }
        }
    }
As in the above example, we have positioned the subtitle to the left of the chart. Here is the complete code for a sample bar chart that includes a title at the top and a subtitle positioned on the left along the yaxis.
<div> <canvas id="myChart"></canvas> </div>


<script src="https://cdn.jsdelivr.net/npm/chart.js"></script> <script src="https://cdn.jsdelivr.net/npm/chartjs-plugin-datalabels@2.0.0/dist/chartjs-plugin-datalabels.min.js"></script>


<script> Chart.register(ChartDataLabels);
var ctx = document.getElementById('myChart');
new Chart(ctx,
{ type: 'bar',
data: {
labels: ['Americas', 'Europe', 'China', 'Japan', 'Asia Pacific'],
 datasets: [
{ label: 'Revenue',
data: [169.7, 95.12, 74.2, 26, 29.4],
backgroundColor: [
'rgb(255, 99, 132)',
'rgb(255, 159, 64)',
'rgb(255, 205, 86)',
'rgb(75, 192, 192)',
'rgb(54, 162, 235)', ],
borderWidth: 1,
 borderRadius: 5,
}
]
 },
 options: { interactions: {mode: 'index'}, responsive: 'true',

plugins: {tooltip:{position:'nearest', intersect: false, backgroundColor: 'white', titleColor: 'black',bodyColor: 'black',displayColors: false, yAlign: 'bottom', caretPadding: 5, padding:12, titleMarginBottom: 10,
callbacks: { label: function (context) { return context.dataset.label + ': ' + '$' + context.formattedValue + ' billion'; } }, },


legend: {position: 'bottom'},


title: {display: true, text: 'Apple Geographic Revenue 2022', position: 'top', align: 'center', font:{size:13}, padding:{top: 10, bottom: 20} },


subtitle: {display: true, text:'Sums in billions', position: 'left', align: 'center' },


datalabels: {align: 'end', Color: 'black',
backgroundColor: 'white',anchor: 'middle', font: {size: 14, weight: 'bold'},
formatter: function(value) { return ' $' + value + ' billion'; },}},


scales: {
y: [{
beginAtZero: true,
} ]
 }
 }
 }
);
</script>
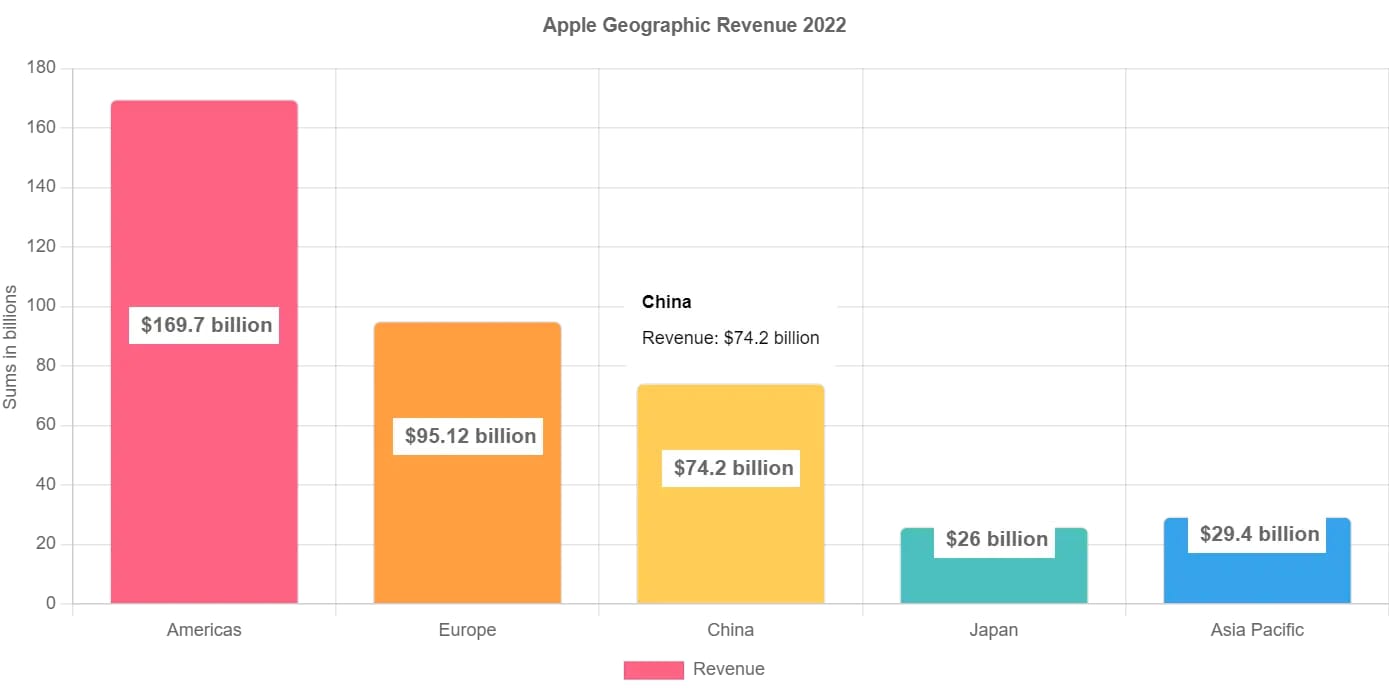
The final chart will look like the following:
.webp)
As you can see the chart includes a title at the top and the subtitle with text ‘Sums in billions’ is positioned on the left along the Yaxis.
SUGGESTED READING
- SAMPLE MIXED CHART IN CHART.JS
- SAMPLE PIE CHART IN CHART.JS