Sample Mixed Chart Chart.js
How to draw a Mixed chart in chart.js
The chart.js javascript charting library is an excellent library for making different types of charts including bar charts, line charts, mixed charts, bubble charts, radar charts, pie charts and so on. These charts are highly customizable which means when you draw charts using chart.js you do not feel limited by features. Chart.js is an open source and well maintained library. It is also the most popular one based on number of downloads and Github stars.
Even if you are not a master of javascript, you can use the chart.js library to create various types of elegant looking charts without difficulty. While it is generally easier to draw a simple bar chart, pie chart or doughnut chart in chart.js, with a few small customizations, you can also easily draw mixed chart types in chart.js. In this post, we are going to show you how to draw a mixed chart that includes a bar chart and a line chart in a single chart.
If you have not installed the chart.js library,you must first install it before moving ahead to draw a chart.
Install chart.js
Installing chart.js is very easy and just like you add bootstrap or tailwind css to a website with the help of a cdn link, you can also install chart.js. The cdn link method is the recommended method for installing the chart.js library. However, you can install it on your server using npm if you do not want to include a link in your website’s html.
To install chart.js, just add the following script to your website’s header:
<script src="https://cdn.jsdelivr.net/npm/chart.js@4.4.2/dist/chart.umd.min.js"></script>
Now, you can start adding charts to your website. Another method to install the chart.js library on your website is to install it using npm. If you do not have npm installed on your server, you can install it with a single command. If you are using ubuntu, ssh to your server and install npm with ‘sudo apt install npm’. Now, you can run the following command to install the chart.js library on your server.
npm install chart.js
Create a mixed chart using chart.js
If you have earlier created charts in chart.js, you must be knowing you need to declare the chart type to draw the chart. When you are creating a mixed chart, which includes two different charts, you will do the same twice as we will show you in this post.
However, first we will create the canvas to draw the chart:
<div> <canvas id="myChart"></canvas> </div>
Now that we have drawn the canvas, we can add the script to draw the final chart. Remember that when we are creating a mixed chart, we are drawing two or more charts on the same canvas. The code will change accordingly and we will provide two datasets for drawing the mixed chart.
Check out the code below:
const mixedChart = new Chart(ctx, {
    data: {
        datasets: [{
            type: 'bar',
            label: 'Bar Dataset',
            data: [10, 30, 50, 70]
        }, {
            type: 'line',
            label: 'Line Dataset',
            data: [50, 40, 50, 30],
        }],
        labels: ['January', 'February', 'March', 'April']
    },
    options: options
});
The above code sets the options for two different chart types including bar and line charts. There are two datasets; one for each of the charts. Each dataset includes the type and data for the respective chart type. Rest of the script is the same as we use when drawing any chart. You can make further customizations like adding datalabels and other customizations.
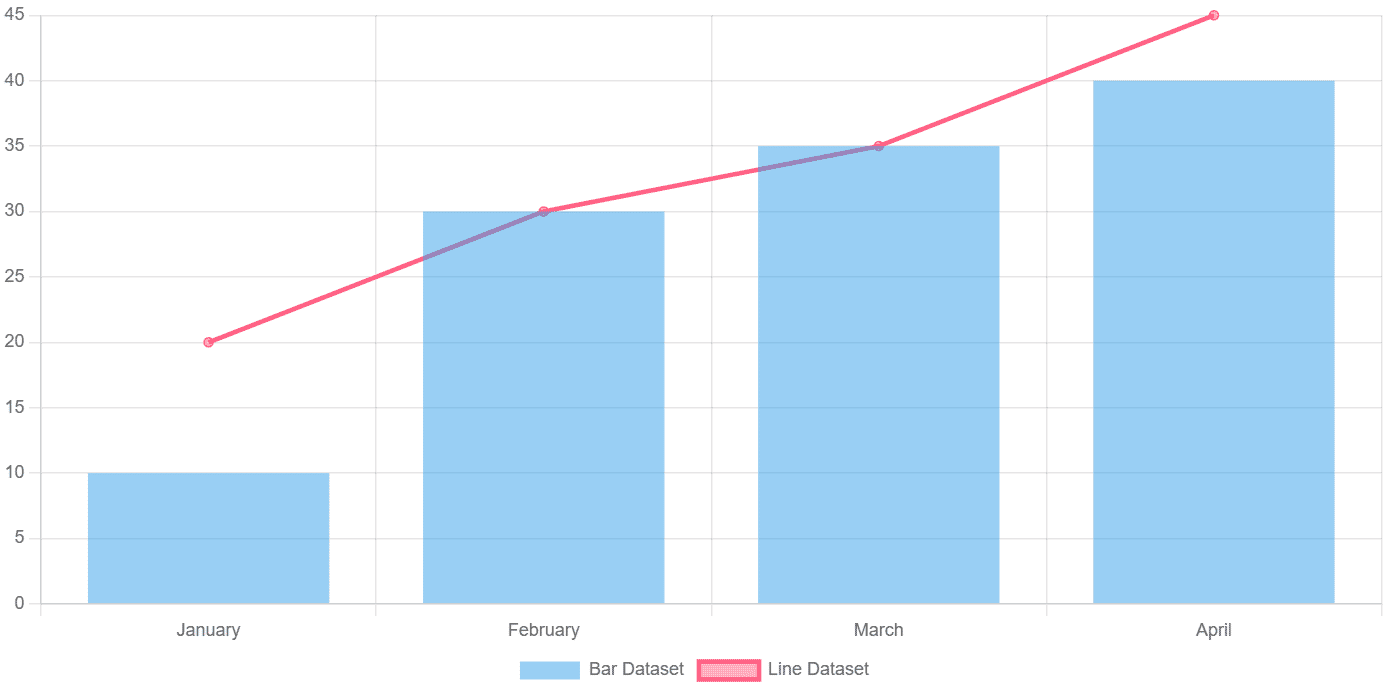
At last, the complete code for out chart looks like the following:
<div> <canvas id="myChart"></canvas> </div>

<script src="https://cdn.jsdelivr.net/npm/chart.js"></script>


<script>
var ctx = document.getElementById('myChart');
new Chart(ctx,
{
data: {  datasets: [{
            type: 'bar',
            label: 'Bar Dataset',
            data: [10, 30, 35, 40]
        }, {
            type: 'line',
            label: 'Line Dataset',
            data: [20, 30, 35, 45],
        }],
        labels: ['January', 'February', 'March', 'April'],
 },
 options: { interactions: {mode: 'index'}, responsive: 'true', plugins: {
legend: {position: 'bottom'},
},
scales: {
y: [{
beginAtZero: true,
}
]
 }
 }
 }
);
</script>
%20(1).png)
We have our mixed chart ready.
Suggested Reading