Chart.js Line Chart Example
Sample LIne Chart in Chart.js
Chart.js is the most popular javascript charting library based on the number of github stars and weekly npm downloads. This javascript based charting library provides you several inbuilt options for drawing various types of charts including line charts, bar charts, mixed charts, bubble charts, pie charts and doughnut charts.
There are additional community maintained chart types that you can use to draw charts like waterfall charts, financial charts or geographical map charts. Chart.js also offers several plugins to customize these charts like the datalabels plugin. The charting library renders charts on a html5 canvas.
Created in 2013, the chart.js charting library has evolved a lot since then and recently, it has released its version 4.4.2. In this tutorial, we will show you how to create a basic line chart in chart.js. You can also create area charts and horizontal line charts with chart.js.
Installing chart.js
The chart.js charting library can be installed using either npm or a cdn link. The cdn link is the recommended method for installation which you can add to your website’s header and start creating charts.
To install the chart.js charting library, you can add the following script to the header of your website, which will install version 4.4.2 of chart.js.
<script src="
https://cdn.jsdelivr.net/npm/[email protected]/dist/chart.umd.min.js
"></script>
Otherwise, you can install chart.js using npm on your server.
npm install chart.js
Once you have installed chart.js, it is time to start creating the chart.
Create a line chart in chart.js
In this tutorial, we are going to create a line chart using chart.js. Line charts are often used to plot data points on a line or to compare two points of data.
The first step to drawing a chart using chart.js is to create a canvas for drawing the chart.
<div>
<canvas id="myChart"></canvas>
</div>
Following that, we can add the script to draw the chart. For example, we will draw a line chart that shows the number of members each year in a committee from 2018 to 2023. To do that, we will have to draw the canvas first and then set the chart type to line.
<div>
<canvas id="myChart1"></canvas>
</div>

<script src="https://cdn.jsdelivr.net/npm/chart.js"></script>

<script>
  var ctx = document.getElementById('myChart1');

  new Chart(ctx, {
    type: 'line',
    data: {
      labels: ['2018', '2019', '2020', '2021', '2022', '2023'],
      datasets: [{
        label: 'Number of members',
        data: [41, 51, 47, 43, 52, 54],
        borderColor: 'rgb(75, 192, 192)',


      }]
    },
options: { plugins:{ tooltip:{mode: 'index'}, }, scales: { y: { beginAtZero: true, } } } });

</script>
You can see that the method of drawing a line chart is similar to that of drawing a bar chart except that you set a different chart type. However, another important thing is that while drawing the line chart, you include a border color that is the color of the line. If you want the line to be blue, you can set the border color to blue.
The script above will output a line chart that looks like the following:
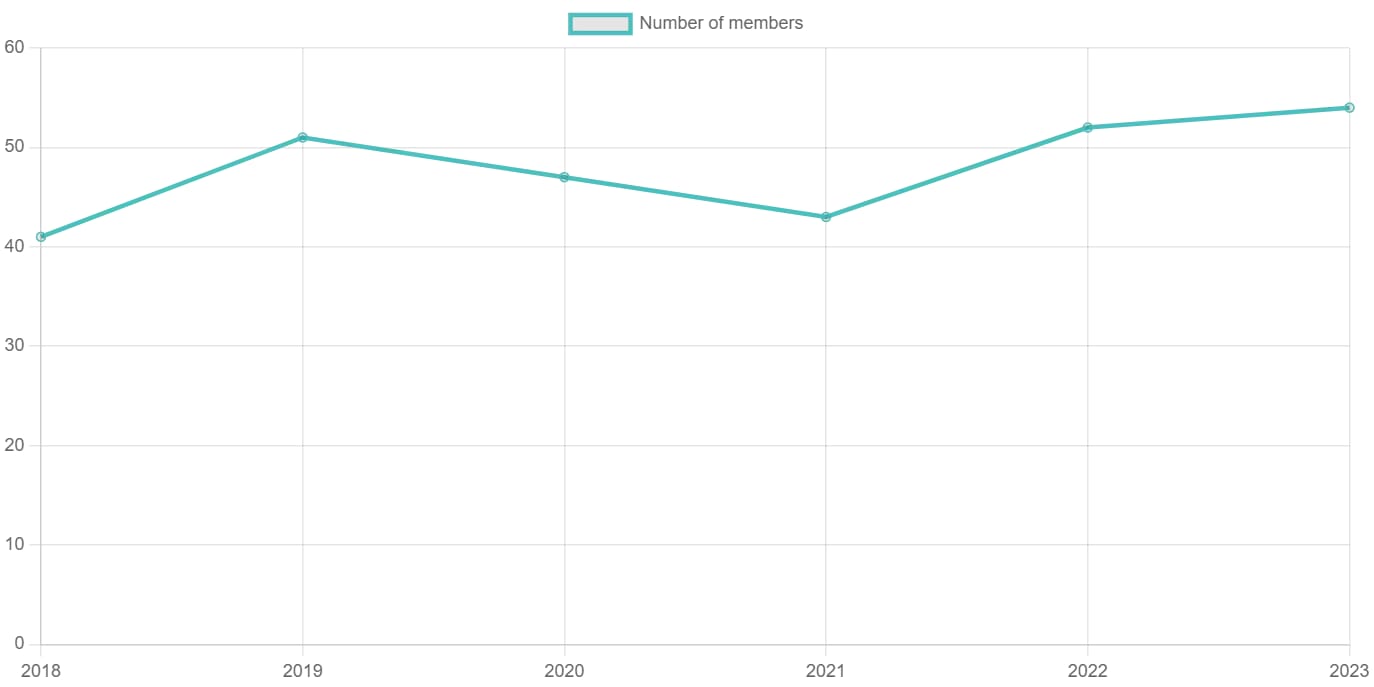
So, this is how you can draw simple line charts in chart.js.
Adding datalabels to line chart in chart.js
While the above chart looks good, it does not look complete and can be improved through customization. You can add data labels to the chart to show the data for each year at each data point. The process of adding data labels to a line chart is similar to the one for applying data labels to the other chart types.
Datalabels is available in the chart.js library as a plugin which you can integrate using its cdn link or by installing it using npm.
Install datalabels plugin using npm:
npm install chartjs-plugin-datalabels --save
Otherwise, integrate it with the following script:
<script src="https://cdn.jsdelivr.net/npm/[email protected]"></script>
Please note that the datalabels plugin must be loaded in the chart after the chart.js library.
After having integrated the datalabels plugin into the chart, we need to register the plugin using:
Chart.register(ChartDataLabels);
So, we can add datalabels to the above line chart and make a few other customizations too so that it looks more attractive and clear. What we are going to do is to add datalabels to the existing chart and remove the gridlines so the chart looks clearer against a plain white background.
We also style the datapoints and use circular datapoints and make more customizations to the datalabels.
Check out the script below:
<div>
<canvas id="myChart1"></canvas>
</div>

<script src="https://cdn.jsdelivr.net/npm/chart.js"></script>
<script src="https://cdn.jsdelivr.net/npm/[email protected]"></script>

<script>
  var ctx = document.getElementById('myChart1');
Chart.register(ChartDataLabels);
  new Chart(ctx, {
    type: 'line',
    data: {
      labels: ['2018', '2019', '2020', '2021', '2022', '2023'],
      datasets: [{
        label: 'Number of members',
        data: [41, 51, 47, 43, 52, 54],
        borderColor: 'rgb(75, 192, 192)',
        pointStyle: 'circle',
        pointRadius: 10,
        pointHoverRadius: 15,
        backgroundColor: 'pink',


      }]
    },
options: { plugins:
{ tooltip:{mode: 'index'}, datalabels: {align: 'end', font:{weight: 'bold'}}},
scales: { x:{grid: {display: false}},
y: { grid:{display: false}, beginAtZero: true, } }
 } });

</script>
The above script renders the following chart.
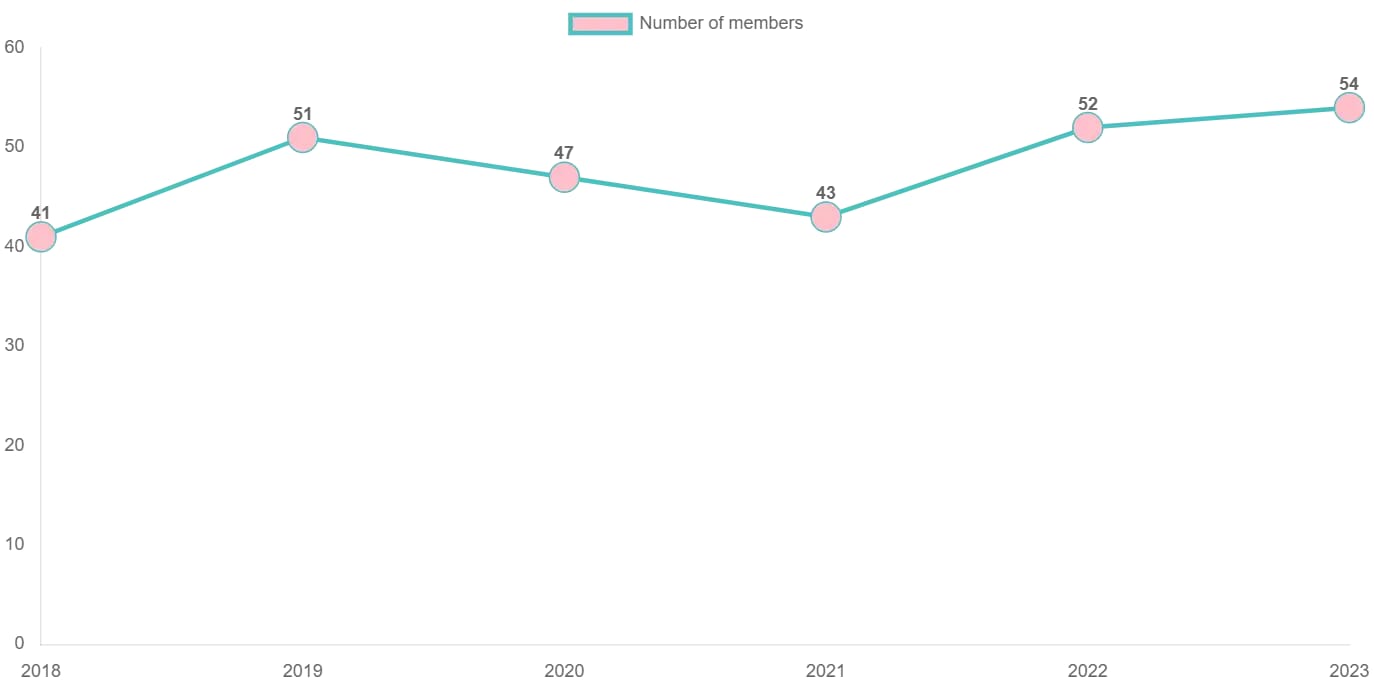
As you can see, we have removed the gridlines from both the axes by setting the display option to false for the gridlines.
scales: { x:{grid: {display: false}},
y: { grid:{display: false}, beginAtZero: true, } }
You may have also noted that we have used circles to style the datapoints. You can also use other shapes like rectangles, star, triangle, rounded rectangles and so on.
Here are the values that pointStyle supports:
- ‘circle’
- ‘cross’
- ‘crossRot’
- ‘dash’
- ’line'
- ‘rect’
- ‘rectRounded’
- ‘rectRot’
- ‘star’
- ’triangle'
- false
You can see that the script includes properties like borderColor, pointStyle, pointRadius, and backgroundColor.
The borderColor property sets the color of the line while the pointStyle sets the style of the data points. The style we have used above is ‘circle’. The pointRadius property sets the radius of the pointStyle. You can use the pointHoverRadius property to change the size of the pointStyle when you hover over it.
In this way, you have an awesome looking line chart to which you can add a title and subtitle if necessary.
Suggested Reading